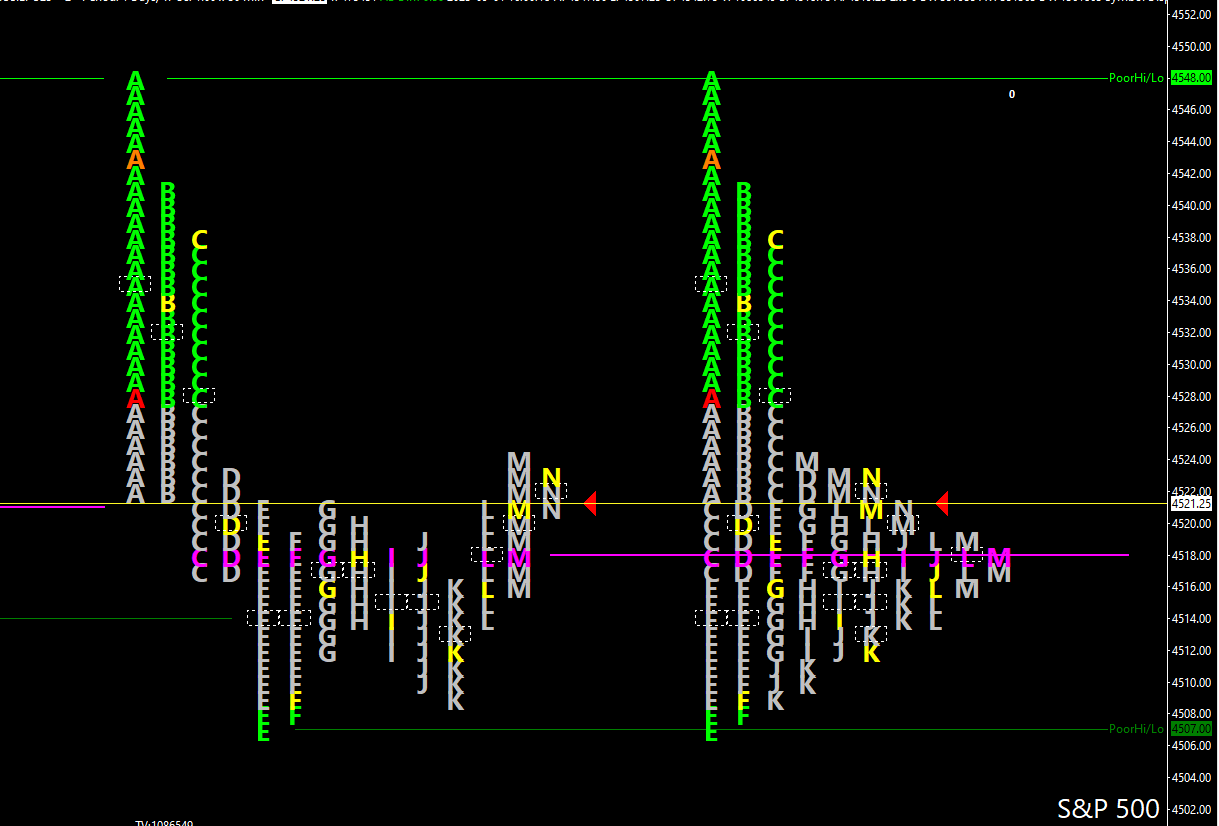
Market Profile is a type of charting tool developed by trader Peter Steidlmayer in the 1980s, initially for the futures market. It’s designed to give traders a better understanding of what is happening in the market by organizing price, time, and volume into a “profile” structure. This helps traders identify areas where the market is likely to accept or reject a particular price level.
Key Components
- Price: The vertical axis represents different price levels.
- Time: The horizontal axis represents the time during which trading occurred at those price levels.
- Volume: Represented by horizontal bars at each price level, indicating the amount of trading activity.
- TPOs (Time Price Opportunities): Letters or blocks that represent a specific time frame and show the price activity during that period.
Key Concepts
- Value Area: The price range where approximately 70% of trading occurred. It’s often where the market finds “fair value” for the asset.
- Point of Control (POC): The price level with the most trading activity, represented by the longest horizontal line on the profile. It acts as a strong support or resistance level.
- Initial Balance: The price range set during the first hour of trading, often used as a reference point for the day’s activity.
- Single Prints: Areas where trading activity was minimal, often indicating rapid price movement.
Advantages
- Market Sentiment: Helps gauge the mood of the market—whether it’s bullish, bearish, or neutral.
- Risk Management: Identifies key support and resistance levels, aiding in setting stop-loss and take-profit orders.
- Intraday Trading: Particularly useful for day traders and short-term investors for making quick decisions.
Limitations
- Complexity: Can be difficult to understand and interpret, especially for beginners.
- Data Intensive: Requires a lot of data for accurate analysis, which might not be readily available for all markets.
- Not a Standalone Tool: Best used in conjunction with other forms of analysis for a more rounded trading strategy.
Market Profile is a versatile tool that can be applied to stocks, futures, forex, and other financial markets. It’s great for traders who want to understand market structure and find high-probability trading opportunities.
