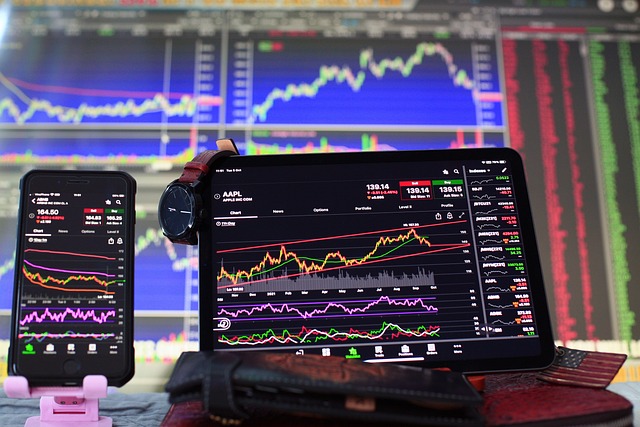
Indicators on stock charts are like the dashboard gauges in a car. They provide additional information about the market’s direction, momentum, volatility, and strength. These indicators help traders make more informed decisions by offering insights that aren’t immediately obvious from the price chart alone. Here are five popular indicators that traders often use:
Moving Average (MA)
The Moving Average smooths out price data to create a single flowing line, making it easier to identify the direction of the trend. The most commonly used types are the Simple Moving Average (SMA) and the Exponential Moving Average (EMA). Traders often use two different periods of MAs and watch for crossovers as buy or sell signals.
Relative Strength Index (RSI)
RSI measures the speed and change of price movements and ranges from 0 to 100. Typically, an RSI above 70 indicates that an asset may be overbought, suggesting it might be a good time to sell. Conversely, an RSI below 30 indicates the asset may be oversold, signaling a potential buy opportunity.
Bollinger Bands
Bollinger Bands consist of a middle band being an N-period simple moving average (SMA) for example 20 period SMA, an upper band at K times an N-period standard deviation above the middle band, and a lower band at K times an N-period standard deviation below the middle band. Teh N stands for the number you multiply the center line by.
The bands expand and contract based on market volatility. Prices are considered high when near the upper band and low when near the lower band.
Moving Average Convergence Divergence (MACD)
MACD is a trend-following momentum indicator that shows the relationship between two moving averages of a security’s price. The MACD is calculated by subtracting the 26-period EMA from the 12-period EMA. When the MACD line crosses above the signal line, it’s often seen as a bullish signal, and when it crosses below, it’s viewed as bearish.
Volume
While not a standalone indicator, volume is often used in conjunction with other indicators to confirm trends and signals. High volume usually confirms the existing trend, while low volume may indicate a reversal or the end of a trend.
Stochastic Oscillator
The Stochastic Oscillator compares a security’s closing price to its price range over a specific period. It generates values between 0 and 100 and is used to identify overbought and oversold conditions. A value above 80 is generally considered overbought, while a value below 20 is considered oversold.
Fibonacci Retracement
This indicator uses horizontal lines to indicate where potential support and resistance levels are. The concept is based on the Fibonacci sequence, a series of numbers where each number is the sum of the two preceding ones. Traders use these levels to identify potential reversal points in the market.
Ichimoku Cloud
The Ichimoku Cloud is a comprehensive indicator that provides information about support and resistance levels, the direction of the trend, and momentum. It consists of five lines: Tenkan-sen, Kijun-sen, Senkou Span A, Senkou Span B, and Chikou Span. When the price is above the cloud, it’s considered bullish; below the cloud is bearish.
Average True Range (ATR)
The ATR measures market volatility by decomposing the entire range of an asset price for that period. It’s particularly useful for setting stop-loss levels and is commonly used in various trading systems to gauge market volatility.
Each of these indicators offers a different perspective on the market and can be valuable in different scenarios. Traders often use a combination of these indicators to formulate a more comprehensive trading strategy. Remember, while indicators can be incredibly useful, they’re not foolproof and should be used as part of a well-rounded trading approach.
The most important thing to remember about indicators, with the exception of candle sticks and volume, is that they are all lagging behind what is actually happening in the market. They are not a predictive tool. Rather more of a confirmation tool.
The most important t
