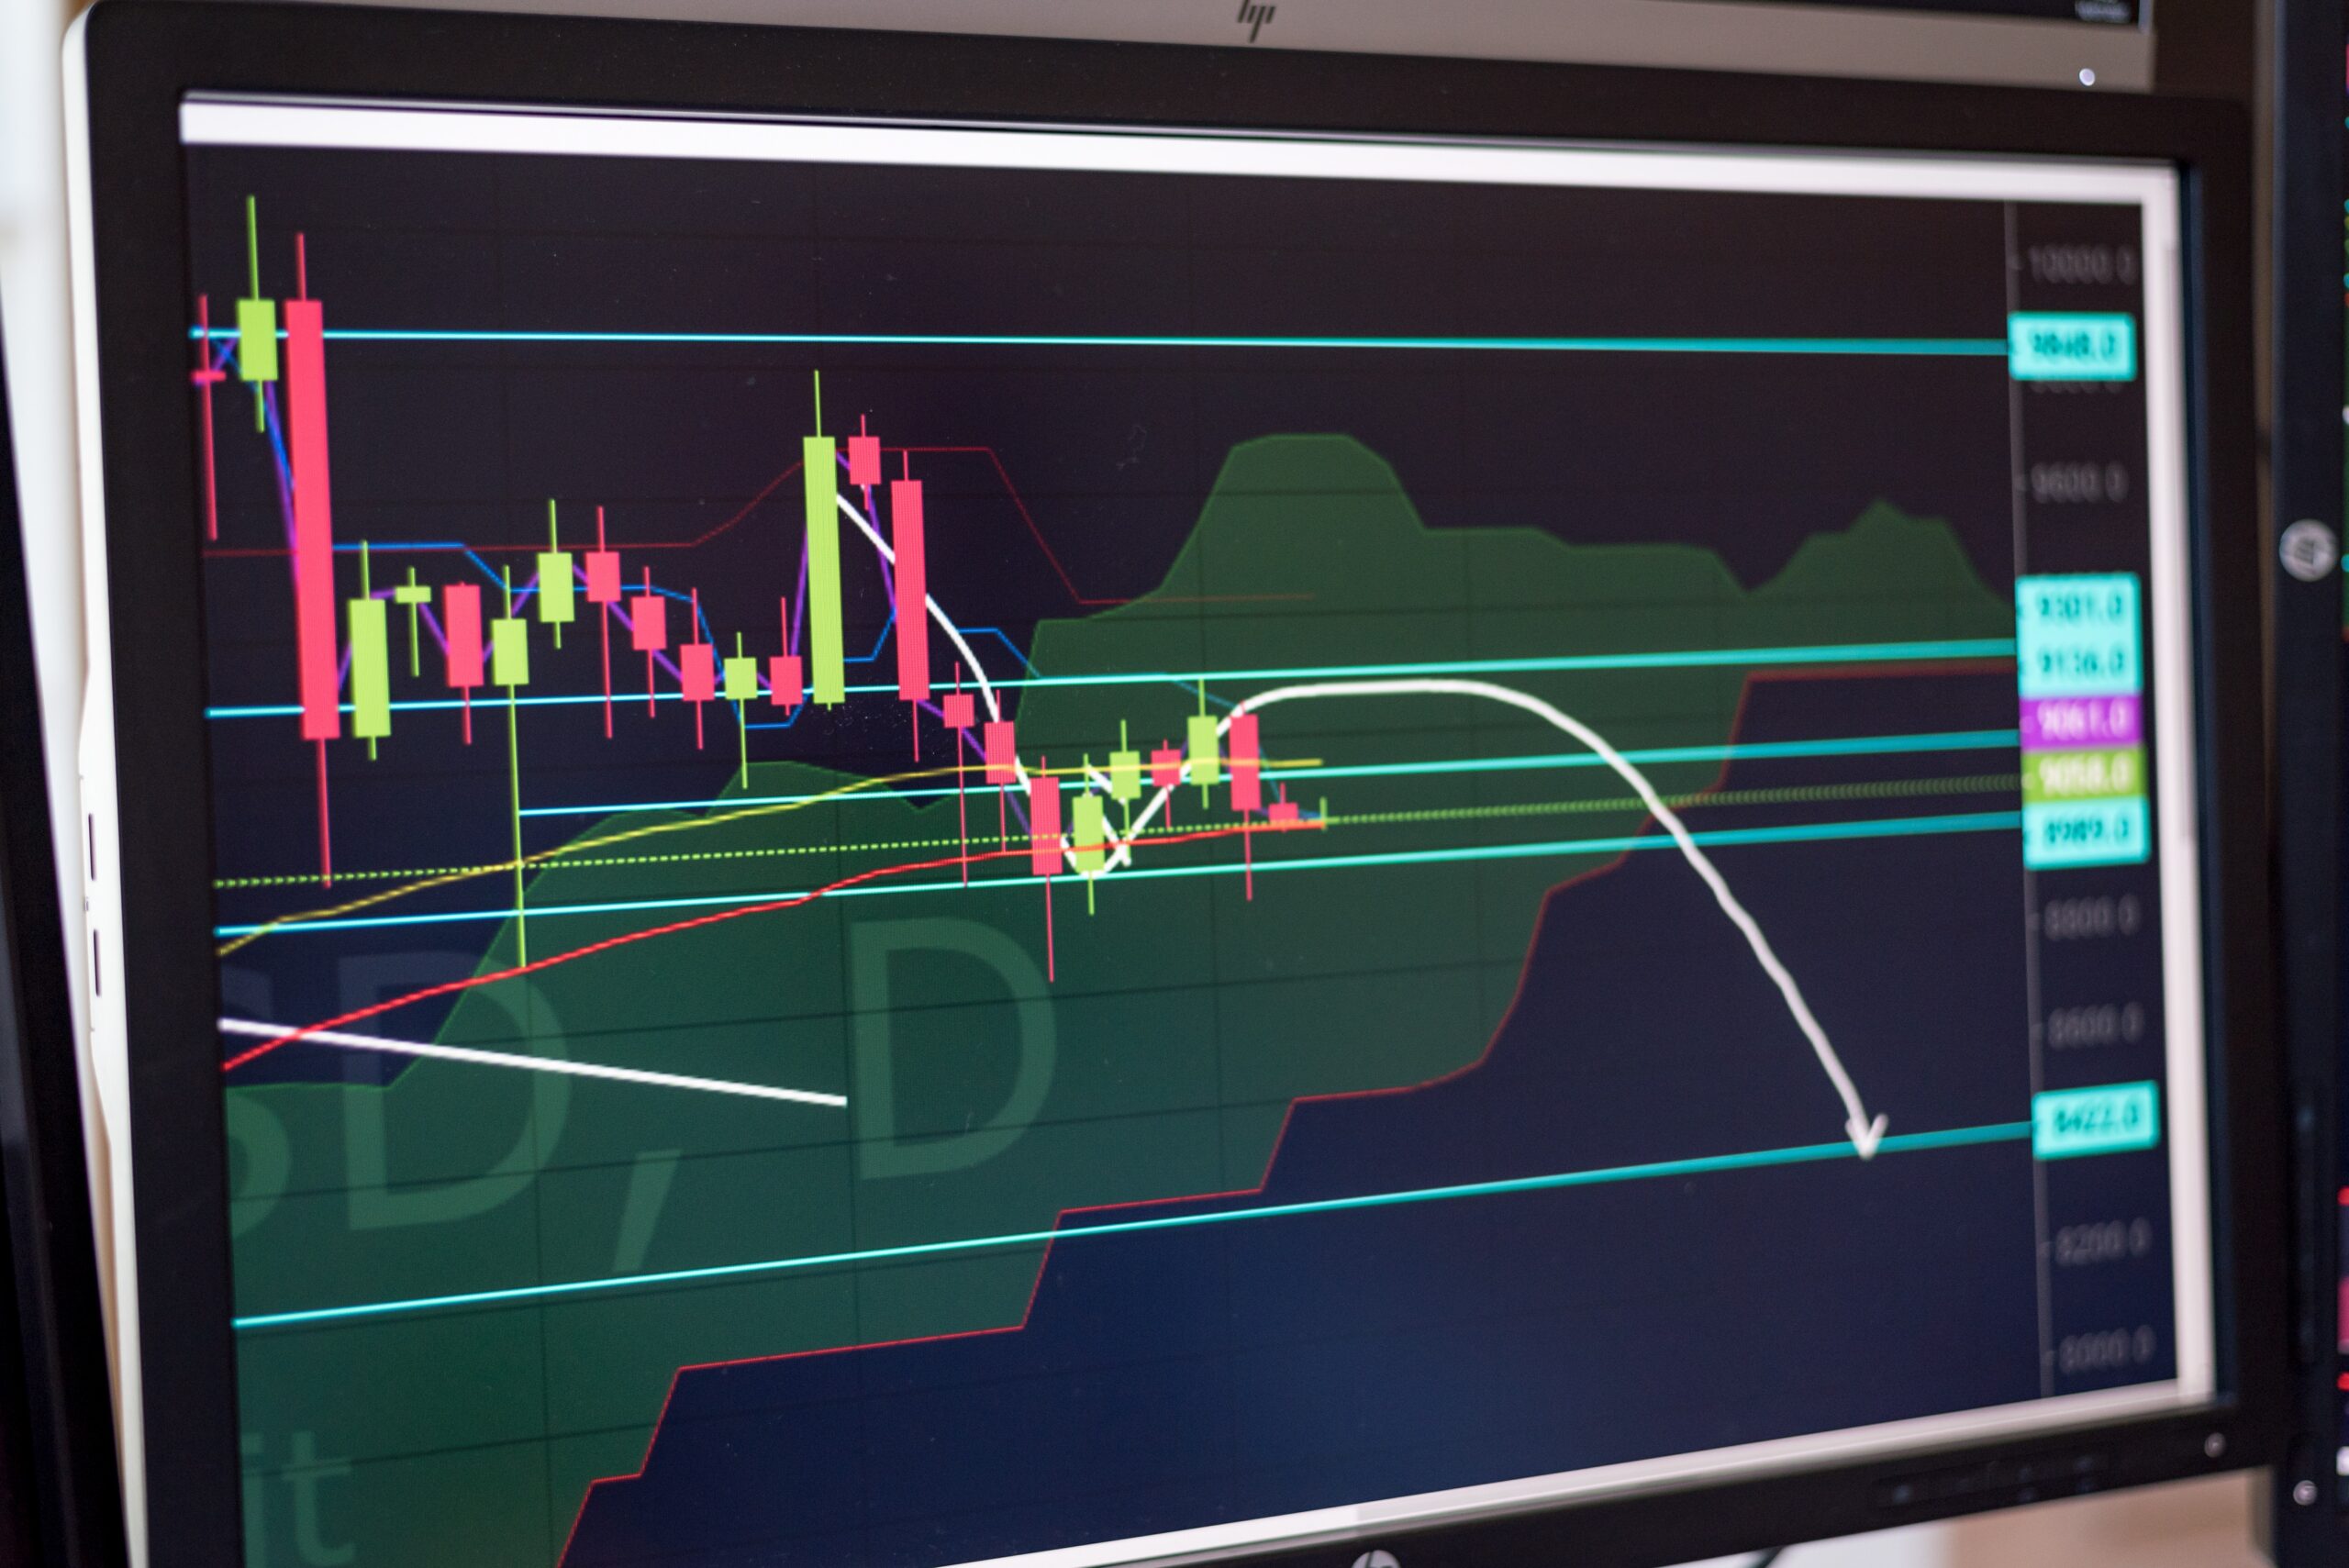
By far the most common tool in the use of market trading is the chart and of course the ubiquitous candlesticks.
Japanese candlesticks, as they are sometimes called, are like the pulse monitors of the financial market. They’re a type of charting method that originated in Japan over 300 years ago and have become a popular tool among traders worldwide. Each candlestick represents a specific time frame and shows the opening, closing, high, and low prices during that period. Let’s delve into why they’re so crucial for day trading.
Visual Clarity
Candlestick charts offer a visually intuitive way to understand market movements. The color-coded candles quickly tell you if the market is bullish (usually green or white) or bearish (usually red or black). This immediate visual feedback can be invaluable when you’re making quick decisions in day trading.
Price Patterns
Candlestick charts are famous for their patterns, like “Doji,” “Hammer,” and “Shooting Star,” to name a few. These patterns can signal potential reversals or continuations in price trends. Recognizing these patterns can give day traders an edge in anticipating future price movements.
Emotional Insight
The shape and size of the candlesticks can offer clues about market sentiment. For example, a long-bodied candle suggests strong buying or selling activity, while a short body indicates less decisive movement. The “wicks” or “shadows” of the candle can also provide insights into the emotional state of traders, showing how prices were pushed before settling.
Multi-Timeframe Analysis
Day traders often use multiple time frames to make trading decisions. Candlestick charts can easily be adapted to various time frames, from one minute to one day, providing a consistent method for analyzing price action across different periods.
Risk Management
Candlestick patterns can also be useful for setting stop-loss and take-profit levels. For instance, the low of a bullish “Hammer” candlestick might serve as a logical place to set a stop-loss order.
Versatility
Candlestick charts are versatile and can be used in conjunction with other technical indicators like moving averages, Bollinger Bands, or RSI. This makes them a flexible tool in a day trader’s arsenal.
Real-Time Decision Making
Day trading requires quick decisions based on real-time data. Candlestick charts update in real-time and can offer immediate insights into price action.
